ASD User Meeting Slides.pptx
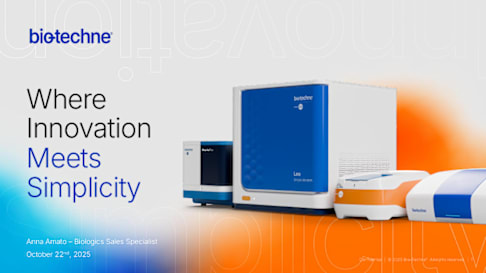
Where Innovation Meets Simplicity Anna Amato – Biologics Sales Specialist October 22nd, 2025
Confidential | © 2025 Bio-Techne®. All rights reserved. | ‹#›
Agenda
Confidential | © 2025 Bio-Techne®. All rights reserved. | ‹#›
2
9:30am | Registration & Social Meetup
10:15am | Welcome Introduction & Overview of Bio-techne
10:30am | Gene Therapy Workflow Solutions
11:00am | Enabling icIEF Peak Identification: Protein Fractionation on MauriceFlex and Subsequent Analysis by LC-MS
12:15pm | Lunch Break
11:30am | Poster Presentations
1:00pm | Panel Discussion featuring our Gene Therapy Experts
The Power of Bio-Techne TO ADVANCE YOUR RESEARCH
7 Analytical Platforms
45+ Years of Innovation
3,000+ Committed Employees
500,000+ Quality Products
500,000+ User Citations
Confidential | © 2025 Bio-Techne®. All rights reserved. | ‹#›
I’d like to first introduce Bio-Techne. Bio-Techne is a global developer, manufacturer, and supplier of high quality reagents, analytical instruments, and precision diagnostics. Bio-Techne was founded on our R&D systems brand, and now is made up of many companies, several of which are listed along the bottom of the slide. Together, we’ve got over 45 years of innovation, with more than 3000 employees supporting over 500,000 products. And our users have amassed over half a million citations using them. We also offer 7 analytical platforms, which is where I’ll be spending the majority of my time today. 3
On the Cutting Edge of Life Science Innovation For more than 45 years
Acquired
Timeline
© 2025 Bio-Techne®. All rights reserved. | ‹#›
A brief history of Bio-Techne We were founded as R&D Systems, an established leader for RUO Recombinant Proteins and ELISA, in Minneapolis, MN, USA in 1976. The company was renamed as Bio-Techne in 2014. We’ve shown continuous growth for over 45 years and have acquired several reputable companies along the way. We have had several acquisitions, lunaphore being latest, special biology.
4
Powering Your Discoveries with Trusted Analytics
10,000+ Labs Trusting the Technology 100+ Commercial Products Supported 4,000+ Citations Automated Systems, Faster Results Reproducible Trusted Data Data Digitization Compliance Stretch Your Samples Further Easy Method Transfer Scale When You Need It
Confidential | © 2025 Bio-Techne®. All rights reserved. | ‹#›
Automating Existing Protein Analysis Workflows 10,000+ Instruments Installed
Pala Gentle and rapid single cell sorting and dispensing instrument and consumables
Simple Plex Fully automated, highly sensitive immunoassays for research and diagnostic applications
Simple Western Only fully automated capillary western solution for protein identification and quantification
Maurice Automated capillary electrophoresis platform for protein purity, charge, identity analysis and fractionation for mass spectrometry
To Deliver Accurate, Reproducible Insights 4,000+ Citations
100+ Commercial Products Supported
Automating Existing Protein Analysis Workflows
© 2025 Bio-Techne®. All rights reserved. | ‹#›
We have 4 key analytical tools that are shown here. 1st- the Pala instrument enables easy, fast and gentle single cell sorting and dispensing capabilities. Next- Simple Plex- This compact system fully automates immunoassays through powerful microfluids and delivers sub-picogram sensitivity. Our Simple Western technology is an automated capillary western that uses capillary electrophoresis for protein separation followed by immunoassay-based detection within a fully enclosed system. Simple Western technology simplifies and automates traditional western blotting process by integrating it into a fully automated capillary system, providing more precise quantitative data than traditional Western blotting due to its controlled and standardized operating conditions. And lastly, our Maurice platform is the gold standard within the bioprocessing space combining CE-SDS and icIEF in 1 instrument enabling target purity, charge and identity analysis in as little as 5 minutes. The Maurice Flex system has the added benefit of fractionation enabling downstream applications such as mass spectrometry. We’ve installed over 10,000 instruments globally, our instrument shave been cited in over 4000 reputable citations and our instrument platforms have supported the commercialization of over 100 products globally. 6
Cell & Gene Therapy Cell Culture RUO Media & Supplements Regenerative Medicine Immune Cell Therapy UltriMatrix, BMEs RUO Small Molecules Differentiation & Phenotype Kits GMP Proteins
GMP Small Molecules
G-Rex TcBuster
GMP IL-2, IL-7 & IL-5 Broad portfolio of GMP reagents and media to enable scalable and cost-effective CGT workflow solutions
GMP Media
© 2025 Bio-Techne®. All rights reserved. | ‹#›
7
From discovery to clinic, Bio-Techne offers unmatched choice and flexibility with uncompromising quality to provide the insights you need with confidence. Reagent Solutions
Proteins Most sought-after portfolio of high-performance proteins
Antibodies Largest and most diverse commercial portfolio of antibodies
Small Molecules Wide range of cutting-edge bio-active small molecules and chemical tools
Immunoassays Most published and trusted ELISA kits
For High-Quality Proteomic Research Industry Leading Proteomic Research Reagents for More than 35 Years
Reagent Solutions
© 2025 Bio-Techne®. All rights reserved. | ‹#›
Bio-Techne combines the quality and legacy of R&D Systems, Novus Biologicals, and Tocris biosciences into one innovative reagent solutions provider. We provide researchers worldwide a comprehensive range of proteins, antibodies, small molecules, and immunoassays, carefully crafted over 35 years by our skilled scientists. Whether unraveling the mysteries of biology or developing a therapeutic, scientists can confidently push the boundaries of their experiments and achieve their next breakthrough.
8
From Development to Manufacturing Ensuring quality and functionality in gene therapy Gargi Chaudhuri Senior Field Applications Scientist
© 2025 Bio-Techne®. All rights reserved. | ‹#›
Thank you for the introduction. I’m happy to be back here at Cell and Gene therapy insights for another Live 30 presentation. Today, I’ll be talking about gene therapy, and how to ensure quality and functionality of AAV products from development to manufacturing using tools from Bio-Techne. 9
Proteins, Antibodies, and Cytokines Faster Development of Cell Therapies Xeno-Free Media
Small Molecules 60+
G-Rex® 6M Well Plate Yield: 200-400x106 cells/well
G-Rex® 10M Series Yield: 200-400x106 cells
G-Rex® 100M Series Yield: 2-4x10⁹ cells
G-Rex® 500M Series Yield: 10-20x109 cells 4
G-Rex® Systems - from 10M to 100B cells INNOVATIVE, RELIABLE REAGENTS FOR REGENERATIVE MEDICINE AND IMMUNE CELL THERAPY WORKFLOWS SCALABLE CLOSED SYSTEMS FOR REGENERATIVE MEDICINE AND IMMUNE CELL THERAPY WORKFLOWS https://www.bio-techne.com/research-areas/cell-and-gene-therapy TcBuster™ Non-viral Gene Editing
| © 2025 Bio-Techne®. All rights reserved. | ‹#›
Although the focus of today’s webinar is gene therapy, I would be doing you a disservice if I didn’t provide some intel on our ability and passion to get your cell therapies developed faster too. Here at Bio-Techne, we offer over 60 innovative, reliable reagents for regenerative medicijne and immune cell therapy workflows – including Xeno-Free Media, Proteins, Antibodies, and Cytokines – offered at both research and GMP-grade, small molecules, and we even have our own Non-viral gene editing platform called TcBuster to help you move away from lentiviral transductions. through our partnership with ScaleReady, we also offer 4 scalable, closed systems for both regenerative medicine and immune cell therapies. These systems, called G-Rex can scale with your needs from 10M to over 100B cells as you gear up to treat patients. To learn more about these offerings, I encourage you to visit our CGT landing page, listed at the bottom of the slide.
10
INNOVATIVE ANALYTICAL TOOLS Faster Development of Gene Therapies 10,000+ Instruments Installed
100+ Commercial Products Supported
4,000+ Citations
Agenda A Brief Introduction to the Platforms The Power of Synergy to Catalyze Advances in Medicine
| © 2025 Bio-Techne®. All rights reserved. | ‹#›
Now, to today’s topic of gene therapy. Bio-Techne offers 7 analytical platforms – and today I will cover 3 of them, shown on this slide. Our platforms have been supporting our customers for quite a few years, and we have over 10,000 instruments in the hands of your colleagues. Of the 500K citations I mentioned, over 4,000 of them leverage these platforms. Together, they support over 100 commercial products across a diverse array of therapies from small molecules, to monoclonal antibodies, to today’s topic - AAVs. In today’s webinar, we will start with a a brief look at each of these 3 platforms, and then I will show you why you need all 3 in your lab to synergize and speed up the development of your gene therapies. 11
Simple Plex PRECISION MULTIPLEXING MADE SIMPLE
Key Features Fast – Data in 90min Conservative – Use only 25mL for triplicate analysis Reproducible – Less than 10% RSDs Sensitive – Low pg/mL detection with wide dynamic range Easy to use – Get operators running quickly
| © 2025 Bio-Techne®. All rights reserved. | ‹#›
First up is our Simple Plex automated ELISA platform. Simple Plex delivers data in under 90min from only 25uL of sample. From that you get triplicate analysis of your sample, with RSDs under 10%. The platform also affords great sensitivity, a wide dynamic range, and is easy to use. 12
Simple Plex PRECISION MULTIPLEXING MADE SIMPLE Automated, hands-free ELISA for viral titer and impurity analysis.
CHO/HEK293T HCP assays leveraging Cygnus Technologies.
Fueled by the industry-leading viral capsid antibodies from PROGEN.
Viral Titer Impurity Analysis
AAV2 HEK293
HEK293T
© 2025 Bio-Techne®. All rights reserved. | ‹#›
Simple Plex is a great platform for cell and gene therapy. It’s ideal for viral titer shown on the bottom left for AAV2, where our AAV cartridges are fueled by PROGEN intact capsid antibodies and can detect intact capsids down to 106 VP/mL with wide dynamic range - which is great for process sample testing. We’ve teamed up with CYGNUS, shown in the middle for both CHO and HEK293T HCP assays – where we’ve got comparable data in only 90min of hands-free time. For today’s story, I’ll show you Simple Plex titer data. 13
Maurice/MauriceFlex AUTOMATED CAPILLARY ELECTROPHORESIS
Key Features Gold standard iciEF – Industry standard for charge heterogeneity and pI analysis CE-SDS – Supports identity and purity analysis of viral vectors Fast – Data in as little as 5.5 min per sample Flexible – Cartridges dictate run mode Fractionation – Isolate charge variants for off-line analysis
| © 2025 Bio-Techne®. All rights reserved. | ‹#›
Our 2nd platform are our Maurice and Maurice Flex platforms. This is the first of two capillary electrophoresis platforms to mention, and is great for downstream characterization of viral vectors. Maurice combines our gold standard icIEF for charge heterogeneity analysis with CE-SDS for identity and purity analysis. These assays are fast, and some complete in as few as 5.5minutes. This platform is also easy to use, with different cartridges and consumables that dictate run mode. And with MauriceFlex, you can fractionate charge variants for offline analysis by mass spec or for binding assays. 14
Maurice/MauriceFlex A powerful capillary electrophoresis direct detection platform that delivers multiple attributes for viral vectors.
Protein Ratios and Purity Capsid Protein PTMs Fractionation Capsid protein ratio and purity analysis.
Monitor deamidation of capsid proteins.
Fractionate capsids or capsid proteins for mass spec.
AUTOMATED CAPILLARY ELECTROPHORESIS
He et al., 2023 Capsid Attributes pI determination, E/F, stability, and formulation.
© 2025 Bio-Techne®. All rights reserved. | ‹#›
Maurice delivers multiple attributes for gene therapy starting on the left with AAV capsid protein ratios and purity analysis – although you can use it for lenti or Ad5 too. Next, we’ve done some nice work with Ultragenyx to show that intact capsid IEF analysis on Maurice is stability indicating. Last year, Pfizer published a powerful paper showing the utility of denatured capsid protein analysis on Maurice for capsid protein deamidation which correlates to product potency monitoring – shown here, where the acidic peak, which is deamidated VP3, grows with stress as we move down the image with time. And lastly, fractionation by cIEF, where we can start to unpeel the complex intact capsid charge profile. For today’s webinar, I’ll show you data for the first 3 of these. But if you are interested in fractionating capsids or capsid proteins, please reach out to me after the webinar. 15
Simple Western AUTOMATED QUANTITATIVE CAPILLARY WESTERNS
Reproducible – CV<20% intra and inter assay Conservative – Use only 3mL sample Fast – Data in as little as 3hrs Sensitive – 3-4 log dynamic range with low pg detection Flexible – Viral, cell, and tissue lysates Established – 2900+ Publications, 5000+ Validated Abs Key Features
| © 2025 Bio-Techne®. All rights reserved. | ‹#›
Lastly, our second CE instrument is Simple Western, our automated quantitative capillary immunoassay platform. Simple Western is where I got my start with ProteinSimple 13 years ago, so it’s near and dear to my heart for sure. The platform is way easier to use than running a traditional westerns and produces significantly better data from only 3uL of sample. With runs completing in 3hrs, you can get a lot of answers from the platform in a single day. It’s a sample agnostic platform, capable of handling viral, cell and tissue lysates. And it’s established, even if this is the first time you are hearing about it. Of those 4000 papers mentioned before, nearly 3000 of them use this platform and we boast close to 5000 validated antibodies from over 70 vendors. 16
Patented method to characterize capsid content in all sample types. Measure protein expression with ease to characterize gene therapy potency.
Get both capsid protein ratios and titer in the same run.
A powerful capillary immunoassay technology that delivers multiple viral vector CQAs.
Protein Expression Potency Empty/Full Protein Ratios and Titer
AAV2 AAV9 AUTOMATED QUANTITATIVE CAPILLARY WESTERNS Simple Western
© 2025 Bio-Techne®. All rights reserved. | ‹#›
Simple Western is an open platform – meaning you can bring whatever sample and primary antibody you need to the platform, just like you would a traditional western. This means that those 4000 papers I just mentioned cover quite a diverse array of applications and research areas. On this slide, like the others, I’m calling out what I see the key applications are for Simple Western in the space starting on the left, and most important, is protein expression potency where you are looking at transgene product expression – this is what Hiren is going to talk about later. Simple Western can also be used for Empty/Full analysis and for capsid protein ratios and titer. Again, because it’s an open platform, you can do some of these same tests for other viruses like LVV and Ad5. Now, today we are going to focus on viral vector potency, by measuring the expression of the protein product. 17
Powerful Solutions for Gene Therapy
Forced Degradation 5d, 37°C
How many AAVs do I have? Do my AAVs look like they should? How well do my AAVs transduce cells? AAV8 CMV-GFP 2 lots
Viral Titer
Simple Plex (Ella) Viral Vector Quality
Maurice Viral Vector Potency
Simple Western (Leo)
Confidential | © 2025 Bio-Techne®. All rights reserved. | ‹#›
Today I’ll show you how these three platforms synergize and provide a powerful solution set for gene therapy analytics. We recently obtained 2 lots of AAV8 and subjected each to forced degradation at 37degrees C for 5 days so that we could analyze a variety of samples. After collecting the stressed materials, we ran a viral titer assay using the Simple Plex Ella platform to know how many capsids we have in each sample. Then, we examined the particles for related critical quality attributes on Maurice to see how the stress changed the particles. And finally, we looked at the vector potency across these 4 lots using Simple Western so we could measure the impact of forced degradation on viral potency. 18
Rapid Titer Assessment with Simple Plex
Confidential | © 2025 Bio-Techne®. All rights reserved. | ‹#›
We first start off by measuring the titer of these 4 AAV8 samples using Simple Plex. 19
Simple Plex AAV8 Titer Assay
2.5e6 –9.4e9 Capsids/ mL
Precision
ELISA Correlation
Confidential | © 2025 Bio-Techne®. All rights reserved. | ‹#›
Our Simple Plex AAV8 titer assay is fueled by PROGEN intact capsid antibodies as I mentioned. The performance data for the assay are shown on this slide. On the left is the built-in AAV8 standard curve – to illustrate the wide dynamic range and exquisite sensitivity of the assay. In the middle are the precision data for low and high QC standards and the ATCC AAV8 reference standard, and on the right, I’ve included the correlation plot to the original ELISA – for those of you wondering if you can easily move to Simple Plex for viral titer. 20
Titer Assessment in 90min Data generated by Francisco Ramirez AAV8 Titer* % CV Lot 1 4.15E+13 5.7 Lot 1 Forced Degradation 2.47E+13 6.0 Lot 2 3.75E+13 4.9 Lot 2 Forced Degradation 3.53E+13 4.7
* Dilution corrected – samples were run at 1010 capsids/mL
Confidential | © 2025 Bio-Techne®. All rights reserved. | ‹#›
We leveraged the Simple Plex AAV8 72 x 1 cartridge to quickly measure the titer of the AAV8 samples, which were diluted and run in the 10 to the 10th capsid per mL range. First, looking at the starting materials shown on the left, we can see that both AAV8 samples had capsid titers near 4 e 13 VP/mL, which Lot 2 being slightly lower than Lot 1. After forced degradation, Lot 1 dropped by 40% which was unexpected, while lot 2 appeared more stable, decreasing by only 6% in capsid titer. These data were highly reproducible, as summarized in the table on the right, with all CVs under 6% . With the capsid titer confirmed, we next looked at the impact of the forced degradation on the AAVs with the Maurice platform. 21
average 0.23699999999999999 0.111 0.189 0.17299999999999999 0.23699999999999999 0.111 0.189 0.17299999999999999 Lot 1 Lot 1 Lot 2 Lot 2 Forced Degradation X Forced Degradation 4.1500000000000004 2.5099999999999998 3.73 3.54 Capsids/mL (x 1013)
Analytical CE for Viral Vector Quality
Confidential | © 2025 Bio-Techne®. All rights reserved. | ‹#›
With the titers measured, we moved on to looking at the quality of these AAV8 samples using our analytical capillary electrophoresis platform, Maurice. 22
Capsid Protein Ratios are minimally impacted by stress AAV8 Capsid Ratio (VP3:VP2:VP1) Lot 1 22.9 : 1.2 : 1 Lot 1 5d, 37C 23.3 : 1.3 : 1 Lot 2 20 : 0.9 : 1 Lot 2 5d, 37C 20.2 : 0.9 : 1
Data generated by Srinivasa Rao, Ph.D.
VP3 dimer VP1 VP3 VP3 dimer VP3a
VP2 Unstressed 5d, 37°C AAV8 Lot 1 Unstressed 5d, 37°C AAV8 Lot 2 VP1 VP2 VP3 VP3a
Confidential | © 2025 Bio-Techne®. All rights reserved. | ‹#›
Using the CE-SDS mode of Maurice, we analyzed all 4 AAV8 samples for capsid protein ratios. Shown on the left is a comparison of Lot 1 before and after forced deg. Overall, the capsid proteins remain pretty similar. Shown on the right are the Lot 2 data, where we again see similar capsid protein ratios before or after forced degradation. Listed below are the capsid protein ratios for the 4 samples. Because these are SF9-derived, the capsid protein ratios are a bit further from the 10:1:1 one might expect to see for an AAV. When we analyze HEK-derived AAVs, we see values closer to that expected value. There are of course benefits to each host system, so wherever your AAVs come from, Maurice can characterize them. 23
Forced Degradation Increases VP3 Deamidation Data generated by Srinivasa Rao, Ph.D. Lot 1 > Lot 2 Basal Deamidation by ~4%
Unstressed Forced Degradation VP3 dVP3 VP3 dVP3 AAV8 Lot 1
Unstressed Forced Degradation VP3 dVP3 VP3 dVP3 AAV8 Lot 2
pI pI VP3 Deamidation 1.7x 1.9x
Confidential | © 2025 Bio-Techne®. All rights reserved. | ‹#›
In 2023, He et al from Pfizer published a nice paper using icIEF for capsid protein deamidation analysis, where they correlated orthogonal data to help identify the charge variants observed by icIEF. We similarly ran these 4 AAV8 samples after denaturation to examine these same samples for capsid protein deamidation. Deamidation of capsid proteins has been shown to correlate with decreases in potency and as shown in the Pfizer paper induces an acidic shift in the pI of the capsid proteins.. To focus your eyes, I’ve only colored in the VP3 and deamidated VP3 peaks in blue. As expected, after 5days at 37C, the dVP3 peak increases significantly in both Lots of AAV8. These data can be quantified and expressed as the dVP3/VP3 ratio. Overall, we observed a 1.7X and 1.9X increase in deamidation upon forced degradation for Lot 1 and Lot 2, respectively. In addition, the basal level of deamidation was about 4% higher in Lot 1 which ties into the next analysis we did for the intact capsids. 24
Sample Lot 1 Lot 1 Lot 2 Lot 2 Forced Degradation X Forced Degradation 20.785622267662273 35.82515048022708 16.787392701570901 31.475415112179668 dVP3/VP3 (%)
Forced Degradation decreases AAV particle pI AAV8 Apparent Particle pI Lot 1 7.08 Lot 1 5d, 37C 6.90 Lot 2 7.10 Lot 2 5d, 37C 6.98
AAV8 Lot 1 Unstressed Stressed
AAV8 Lot 2 Unstressed Stressed Data generated by Srinivasa Rao, Ph.D. Δ pI = 0.177
Δ pI = 0.119
Confidential | © 2025 Bio-Techne®. All rights reserved. | ‹#›
Based on the capsid protein deamidation data, one might expect the overall particle pI to change upon forced degradation since there are a total of 60 proteins in the capsid and most of them are VP3. We analyzed the same 4 samples using an intact AAV particle icIEF method, which is gentle and maintains particle integrity. The unstressed samples both had apparent pI’s near 7.1, with the Lot1 capsids being slightly more acidic at the start. The particle pIs shift to a more acidic pI after 5 days at 37C, which is driven in part by the deamidation. The change in pI is shown for each sample, which was almost 0.2pH units for Lot 1 and slightly less for lot 2. The same assay can be used to look at the capsid content, leveraging the dual wavelength detection capability of Maurice. 25
Forced Degradation Impact of DNA Content AAV8 Fluorescence Absorbance Abs/FL Lot 1 385149.93 245.03 0.64 Lot 1 Stressed 484032.73 243.38 0.50 Lot 2 355085.85 314.25 0.88 Lot 2 Stressed 425838.40 293.68 0.69
AAV8 Lot 1 AAV8 Lot 1 AAV8 Lot 2 AAV8 Lot 2 5d, 37C 5d, 37C DNA (shaded in) Capsid NF (black trace) Lot 1 Δ = -21.8% Lot 2 Δ = -21.6%
Data generated by Srinivasa Rao, Ph.D.
Confidential | © 2025 Bio-Techne®. All rights reserved. | ‹#›
We also examined the relative capsid content of each AAV samples in a method that completes in only 10min per sample and uses just a few microliters of the AAV. For this assay, we use the native fluorescence data obtained from Maurice to monitor the capsid shown in the black traces, and the absorbance at 280nm to account for the ssDNA genome, which I’ve shaded in. You can readily appreciate a shift in the particle pI as I showed on the previous slide with forced degradation, and the genome of course goes along for the ride so to speak, shifting as well. When we quantify these data, summarized on the right, there’s loss of genome after forced degradation. This isn’t unexpected, as there are several published reports of genome ejection at higher temperatures for extended periods of time. 26
Protein Expression Potency using Simple Western
© 2025 Bio-Techne®. All rights reserved. | ‹#›
With our capsid titers and a deep understanding of how the 2 AAV8 lots compare, both before and after forced degradation, we next asked how well they transduce cells and express the transgene protein product of interest. We’ve previously used a Simple Western instrument called Jess for this work, but today I am pleased to show you some of the very first data from the newest member of the Simple Western family, LEO. 27
Up to 100 capillaries per run 3 hour turn around time High sensitivity chemiluminescence with high dynamic range RePlex and total protein normalization Flexibility to run 25-100 capillaries per run Multiplex up to 8 targets per sample Save ~50% on antibody usage Compass for Simple Western 7.0 with powerful data analysis Software version that enables 21 CFR Part 11 compliance Upgradable to fluorescence
Leo KEY FEATURES Available in 2025
© 2025 Bio-Techne®. All rights reserved. | ‹#›
Leo provides all the benefits of existing Simple Western platforms like Jess and Abby, fully automating protein separation and immunodetection. Leo works with small sample volumes to provide reproducible protein quantitation with high dynamic range and fast time to results. Leo goes even further by providing additional capabilities. Some of the key features of Leo include the ability to process up to 100 capillaries in a single run, with a ~3 hour turnaround time, the flexibility to run 25-100 capillaries per run and increased multiplexing capability, and Leo does all of this with efficient reagent usage. Leo will support chemiluminescence at launch and will be upgradeable to support fluorescence later.
28
Potency Testing “To obtain a biologics license, a biologics license application (BLA) must contain data demonstrating that the product is safe, pure, and potent, and the continued safety, purity, and potency of the product must be assured.” - Potency Assurance for Cellular and Gene Therapy Products FDA Draft Guidance for Industry, December 2023
4 AAV8 CMV-GFP lots were dosed at 7 MOIs from 3e6 to 0 into HEK293 cells for 48hr prior to harvest for Simple Western analysis by Jess and Leo. Experimental Design Relative Potency Testing AAV8 CMV-GFP Transduction in HEK293 cells
Lot 1
Lot 2
Lot 1 FD
Lot 2 FD d d d d
Confidential | © 2025 Bio-Techne®. All rights reserved. | ‹#›
According to the most recent guidance from the FDA, “To obtain a biologics license, the application must contain data demonstrating that the product is safe, pure, and potent, and the continued safety, purity, and potency of the product must be assured. To showcase how Simple Western can be used for protein expression potency testing, we obtained 2 lots of AAV8 CMV-GFP and transduced HEK cells at 7 MOIs from 3 million down to 730 viruses for 48 hrs prior to harvesting for Simple Western analysis.
29
Relative Potency Testing Simple Western Analysis
32 Samples were generated in the experiment.
Lysates were normalized for total protein before being prepared for split sample analysis. Samples were run n = 3 for ease dose Samples first probed with an anti-GFP antibody and then using RePlex for Total Protein for accurate normalization between samples. 2 Assays were run with these samples Protein Expression Relative potency Absolute GFP quantitation
Confidential | © 2025 Bio-Techne®. All rights reserved. | ‹#›
This experiment generated 32 samples to analyze. We generated lysates and got the protein concentrations by BCA again. We normalized lysate concentrations for the sample loading and then prepared samples for split analysis on Jess and Leo. For Jess, the samples were all run in duplicate and for Leo all samples were run 6 times. The lysates were probed first with an anti-GFP antibody from Bio-Techne to measure the amount of expressed GFP and then after RePlex with total protein for accurate normalization between the samples. There are actually two types of assays that can be run with these samples. First, as I described, for measuring the relative potency of the two lots of AAV8. But as I discussed earlier, Simple Western is a truly quantitative immunoassay and can be used to measure the absolute amount of the GFP expressed by each lot of AAV at each MOI. Let’s first look at the potency comparison. 30
Total Protein Transduction of HEK293 with AAV8 Lot 2
GFP AAV8 – Lot 2 3e6 7.5e6 1.9e5 4.7e4 1.2e4 2.9e3 7.3e2 Data generated by Bhamini Purandare
Confidential | © 2025 Bio-Techne®. All rights reserved. | ‹#›
On this slide is an example of the data for AAV8 lot 2. There’s nice titration of the GFP signal with decreasing dose, and the total protein area, which is mostly to the right of the GFP signal, is very consistent across all MOIs. These total protein data are used to automatically normalize the peak areas of the GFP signal in each capillary by simply clicking a button in Compass.
31
1
2
3
1
2
3
1
2
3
1
2
3
1
2
3
1
2
3
1
2
3
1
2
3
Sample Replicate Transduction of HEK293 with AAV8 Lot 2 Data generated by Bhamini Purandare
Confidential | © 2025 Bio-Techne®. All rights reserved. | ‹#›
Here are the same data, shown with our Compass lane view to help drive the point that for every capillary there are two sets of data. First the GFP expression in the HEK sample, and then after RePlex, for total protein shown in blue like you’d see in a Coomassie. Lane view is another great way to visualize your data, and it’s also just a button click away inside our Compass for software. 32
Relative Potency of AAV8 Samples - Leo Data generated by Bhamini Purandare, PLA analysis by Francisco Ramirez Relative Potency %CV Lot 1 1 - Lot 1 FD 0.42 3.3
Relative Potency %CV Lot 1 1 - Lot 1 FD 0.42 3.3 Lot 2 1.91 0 Lot 2 FD 0.92 5.5
Keeping Lot 1 as the Reference Lot
Relative Potency %CV Lot 2 1 - Lot 2 FD 0.48 5.4
3 4 5 6 7
3 4 5 6 7
vg/cell (log) C o r r . A r e a ( l o g , n = 3 ) Lot 1
Lot 1 Stressed
Lot 2
Lot 2 Stressed
Confidential | © 2025 Bio-Techne®. All rights reserved. | ‹#›
Shown across the top of the slide are the GFP expression data across the 4 AAV8 lots for all doses, run in triplicate. We measured the relative potency of the 4 samples using parallel line analysis, which is the most common method. In PLA for relative potency, one sample is treated as the reference sample and the other as the test article. For the analysis, we used each unstressed lot as the reference, and the forced degradation material as the test material. Shown on the left is the Lot 1 comparison, where the forced degradation decreased the potency by 58%. We did the same analysis for Lots 2 shown in the middle. The potency dropped slightly less, to only 52%. Both potency calculations were highly reproducible with CVs under 5.4%. Shown on the right is a comparison of all 4 lots to show the parallelism of all 4 dose response curves. Using lot 1 as the reference, I’ve reported the other 3 samples relative to it. This showcases that Lot 2 is nearly 2X more potent that Lot 1, and that difference is observed in both the unstressed and forced degradation materials. 33
Absolute Quantification of Protein Expression
rGFP Standard Curve (Log/Log)
rGFP range 20-0.15 ug/mL Run in triplicate 2-fold dilutions GFP Data generated by Bhamini Purandare
Replicate 1 Replicate 2 Replicate 3 rGFP Calibration Curve Run on Cartridge 1
Confidential | © 2025 Bio-Techne®. All rights reserved. | ‹#›
Simple Western can also be used for quantitative biomarker measurements. We ran the same samples from the relative potency work against a recombinant GFP protein. Shown on the left is the recombinant protein titration from 20 to 0.15ug/mL, run in triplicate on the first cartridge of a Leo run. Shown on the right is the lane view of the triplicate data. Using the new Log/log plot feature in Compass, we plotted these points to get a calibration curve to then measure the GFP expressed by the AAV transductions. 34
Absolute Quantification of Protein Expression Data generated by Bhamini Purandare
Lot 1
Lot 2
Lot 1FD
Lot 2 FD
AAV8 Transduced HEK293 GFP Expression
rGFP Calibration Curve
Confidential | © 2025 Bio-Techne®. All rights reserved. | ‹#›
Shown on this slide are the HEK lysate samples transduced with the 4 lots of AAV, plotted against the GFP standard curve in red dots. Nearly all of the points fall within the calibration curve, enabling accurate quantification of the GFP expressed by these AAV transductions. 35
Absolute Quantification of Protein Expression ~1.84X Higher GFP Expression from Lot 2 ~1.94X Higher GFP Expression from Lot 2
Confidential | © 2025 Bio-Techne®. All rights reserved. | ‹#›
I’ve summarized the GFP expression for Lots 1 and 2, on the left where we observed higher average GFP expression with Lot 2. Similarly, this trend continued when looking at the forced degraded samples, on the right where an average 1.94 fold higher GFP expression was measured with Lot 2. These data correlate well with the higher relative potency measurements which indicated Lot 2 was more potent than Lot 1. 36
Lot 1 0.23617366491628453 4.3133513652372169E-2 6.6468037431497299E-3 0.23617366491628453 4.3133513652372169E-2 6.6468037431497299E-3 750000 189000 4700 7.7919999999999998 1.7615000000000001 0.42949999999999999 Lot 2 0.17677669529663689 0.21708178182425938 2.0576807332518796E-2 0.17677669529663689 0.21708178182425938 2.0576807332518796E-2 750000 189000 4700 13.135 3.5365000000000002 0.7783500000000001 MOI
ng/mL GFP in 100ug/mL HEK293 lysate
Lot 1 FD 0.1697056274846574 0.17041273426594955 1.1525840533350033E-2 0.1697056274846574 0.17041273426594955 1.1525840533350033E-2 3000000 750000 188000 10.71 2.9195000000000002 0.75954999999999995 Lot 2 FD 1.414213561793653E-2 5.1618795026633697E-2 8.4852813742035613E-3 1.414213561793653E-2 5.1618795026633697E-2 8.4852813742035613E-3 3000000 750000 188000 19.450000000000003 5.5175000000000001 1.603 MOI
ng/mL GFP in 100ug/mL HEK293 lysate
AAV8 Forced Degradation Summary
Simple Plex
Maurice
Simple Western (Leo) AAV8 Capsid Titers (VP/mL) Capsid Protein Ratios VP3 Deamidation Particle pI Capsid Content Ratio Relative Potency (Control vs FD) Lot 1 4.15E+13 22.9 : 1.2 : 1 20.8% 7.08 0.64 1 Lot 1 – 5d, 37°C 2.47E+13 23.3 : 1.3 : 1 35.8% 6.90 0.50 0.42
Lot 2 3.75E+13 20.0 : 0.9 : 1 16.8% 7.10 0.88 1 Lot 2 – 5d, 37°C 3.53E+13 20.2 : 0.9 : 1 31.5% 6.98 0.69 0.48
5d, 37°C
Confidential | © 2025 Bio-Techne®. All rights reserved. | ‹#›
I wanted to tie everything together before I finish up today. We started with 2 lots of AAV8, and subjected both to 5days at 37C. This caused small changes in capsid protein ratios, but significant increases in deamidation and genome ejection. Those changes were reflected in the transduction efficiency of the AAVs, where forced degradation resulted in between 30 and 40% drop in potency. Additionally, when comparing lot 1 and 2, we saw that lot 2 was more potent prior stress. 37
Summary Bio-Techne provides world-class, cutting edge automated analytical solutions for cell and gene therapy Two lots of AAV8 were obtained, and subjected to forced degradation at 37°C for 5 days Simple Plex provided viral titer in under 90min, fueled by PROGEN intact capsid antibodies Maurice measured AAV8 CQAs CE-SDS provided capsid ratios icIEF gave capsid protein deamidation analysis, and AAV particle characteristics (empty/full, particle pI) Simple Western measured protein expression potency Data were more sensitive than flow cytometry Forced degradation reduced AAV8 potency, at different levels for each production lot Absolute quantification of GFP was obtained in a single run, down to XX pg/GFP per cell
Confidential | © 2025 Bio-Techne®. All rights reserved. | ‹#›
To summarize today’s webinar Bio-Techne is a provider of innovative, automated analytical solutions for the cell and gene therapy industry. In the study presented today, two lots of AAV8 were subjected to forced degradation at 37°C for 5 days. Bio-Techne's Simple Plex system, powered by PROGEN intact capsid antibodies, provided viral titer in under 90 minutes. Our Maurice platform measured viral vector critical quality attributes using both separation modes. CE-SDS was used to obtain viral capsid protein ratios, while icIEF obtained capsid protein deamidation and a variety of particle characteristics including particle pI, and empty/full. Lastly, our brand new Simple Western platform, LEO, was used to determine the protein expression potency of these samples, which was more sensitive than flow cytometry. The results showed a reduction in AAV8 potency due to forced degradation, at different levels for each production lot. Simple Western also enabled the absolute quantification of GFP in a single run, down to an impressive level of XX pg/GFP per cell, demonstrating the power and value of the technology for the biotech industry. 38
Thank you!
Confidential | © 2025 Bio-Techne®. All rights reserved. | ‹#›
image6.jpg
image4.png
image23.png
image8.jpg
image11.jpg
image29.png
image30.png
image31.png
image32.png
image24.png
image25.png
image26.png
image27.png
image28.png
image15.jpeg
oleObject2.bin
image16.emf
image21.png
image33.svg .MsftOfcThm_Background1_Fill_v2 { fill:#FFFFFF; }
image34.png
image35.png
image12.jpg
image36.png
image37.emf
oleObject1.bin
image14.emf
image45.svg .MsftOfcResponsive_Fill_0033b7 { fill:#0033B7; }
image38.png
image39.svg .MsftOfcThm_Background1_Fill_v2 { fill:#FFFFFF; } .MsftOfcThm_Background1_Stroke_v2 { stroke:#FFFFFF; }
⟶
image40.png
image41.png
image42.png
image43.png
image44.png
image51.png
image52.png
image53.png
image54.png
image55.png
image56.png
image57.png
image58.png
oleObject3.bin
image46.emf
image47.png
image48.png
image49.png
image50.png
image59.png
image60.png
image61.png
image62.png
image20.png
image22.svg .MsftOfcThm_Background1_Fill_v2 { fill:#FFFFFF; }
image63.png
image64.png
image65.png
image73.png
image74.png
image75.png
image76.png
image66.png
image67.png
image68.png
image69.png
image70.png
image71.png
image72.png
image77.png
image78.png
image79.png
image80.png
image81.emf 10
5
10
6
10
7
10
8
10
9
10
10
10
11
0.1
1
10
100
1,000
10,000
AAV2 concentration (capsids/mL)
S
i
g
n
a
l
(
R
F
U
)
Dynamic range
image82.png
image83.png
image84.png
image85.jpeg
image86.png
image87.png
image88.png
image89.png
image90.png
image91.png
image92.png
image93.png
image94.png
image95.png
image96.png
image97.png
image98.png
image99.svg
image9.jpg
image100.emf 10
5
10
6
10
7
10
8
10
9
10
10
10
11
0.01
0.1
1
10
100
1,000
10,000
AAV8 concentration (capsids/mL)
S
i
g
n
a
l
(
R
F
U
)
Dynamic range
image101.emf L
Q
C
H
Q
C
R
S
M
(
A
T
C
C
)
10
6
10
7
10
8
10
9
10
10
AAV8
c
a
p
s
i
d
s
/
m
L
2.9%
5.2%
4.0%
image102.emf 0
2
×
1
0
1
3
4
×
1
0
1
3
6
×
1
0
1
3
8
×
1
0
1
3
1
×
1
0
1
4
1
.
2
×
1
0
1
4
1
.
4
×
1
0
1
4
0
2×10
13
4×10
13
6×10
13
8×10
13
1×10
14
1.2×10
14
1.4×10
14
ELISA (capsids/mL)
E
l
l
a
T
M
(
c
a
p
s
i
d
s
/
m
L
)
image103.png
image104.png
image105.png
image106.png
image107.png
image108.png
image109.png
image17.png
image18.png
image19.svg
image110.png
image111.png
image112.png
image113.png
image114.png
image115.png
image116.png
image117.png
image118.png
image119.png
image120.png
image121.png
image122.png
image123.png
image124.png
image125.png
image126.png
image127.png
image128.png
image129.png
image130.png
image131.png